• Saltar a la navegación principal
  • Saltar al contenido principal
  • Saltar al pie de página
Bluetab

Bluetab

an IBM Company

  • Soluciones
    • DATA STRATEGY
    • DATA READINESS
    • DATA PRODUCTS AI
  • Assets
    • TRUEDAT
    • FASTCAPTURE
    • Spark Tune
  • Conócenos
  • Oficinas
    • España
    • Mexico
    • Perú
    • Colombia
  • talento
    • España
    • TALENT HUB BARCELONA
    • TALENT HUB BIZKAIA
    • TALENT HUB ALICANTE
    • TALENT HUB MÁLAGA
  • Blog
  • English

Blog

Incentives and Business Development in Telecommunications

octubre 9, 2020 by Bluetab

Incentives and Business Development in Telecommunications

Bluetab

The telecommunications industry is changing faster than ever. The growing proliferation of competitors forces operators to consider new ways of being relevant to customers and businesses. Many companies have decided to become digital service providers, with the aim of meeting the needs of increasingly demanding consumers.

Telecommunications companies have endured a decade of continual challenges, with the industry subjected to a series of disruptions that push them to innovate to avoid being left behind. The smartphone revolution has led consumers to demand unlimited data and connectivity over other services.

Some studies show that the main challenges facing telecoms operators are growing, disruptive competition, agility, and investment, from which four key messages are drawn for understanding the future of the sector:

1. Disruptive competition tops the list of sector challenges

Platforms like WhatsApp-Facebook, Google and Amazon have redefined the customer experience by providing instant messaging services, which have had a direct impact on demand for services such SMS, drastically decreasing it.

Additionally, the market trend is to offer multi-service packages and to enable the customer to customise them according to their own needs, leading to mergers, acquisitions and partnerships between companies, in order to offer ever more diverse services.

2. Commitment to digital business models and innovation in the customer experience

The great opportunities offered by digitisation have made it the concept that the vast majority of companies in the sector aspire to. It is not surprising that in the telecommunications sector too, attempts are being made to move towards a digital business model.

According to the Vodafone Enterprise Observatory, 53% of companies understand digitisation as the use of new technologies in their business processes and 45% as the use of new technologies to improve customer service.

3. The post-2020 landscape will be transformed by 5G

The new generation of mobile telephony, 5G, that will revolutionise not only the world of communications but the industry of the future, has just reached Spain. The four domestic operators – Telefónica, Orange, Vodafone and MásMóvil – have already launched the first commercial 5G services, although only in major cities, with reduced coverage and greatly limited technical capabilities. This early start has also been influenced by the change that has occurred due to the COVID-19 pandemic, which has revealed the need for good quality connection at all times for smart working, digital education, on-line shopping and the explosion of streaming. Spain has Europe’s most powerful fibre network, but there are still regions without coverage. Thanks to full commitment to FTTH (fibre-to-the-home), Spain has a stable connection that runs from the telephone exchange to home directly. According to data from the Fibre to the Home Council Europe 2020, Spain has more fibre-connected facilities (10,261) than France, Germany, Italy and the United Kingdom put together.

The operators play a leading role with these needs for digitisation.

Measures to be taken into account

Achieving such long-awaited digitisation is not an easy process, and it requires a change in organisational mentality, structure and interaction.

While talent is believed to be a key element for digital transformation, and a lack of digital skills is perceived to be a barrier to that transformation, actions say otherwise. Because only 6% of managers consider growth and retention of talent to be a strategic priority.

Workers’ perspective on their level of work motivation:

  • 40% feel undervalued and unappreciated by their company. This increases the likelihood that employees will look for another job that will give them back their motivation to work.
  • 77% of workers acknowledge that they would get more involved in their work if their achievements were recognised within the organisation.
  • Over 60% of people state that an incentives or social benefits programme contributes to them not wanting to look for another job. This is something for companies to take into account, because it is estimated that retaining talent can generate increases in company profits of between 25% and 85%.

Companies’ perspective on their employees’ level of work motivation:

  • 56% of managers of people say they are “concerned” about their employees leaving the company.
  • 89% of companies believe that the main reason their workers look for another job is to go for higher wages. However, only 12% of employees who change company earn more in their new jobs, demonstrating that it is not economic remuneration alone that motivates the change.
  • 86% of companies already have incentives or recognition systems for their employees.

So, beyond the changes and trends set to occur in this sector, Telecommunications companies need to intensify their talent retention and make it a priority to address all the challenges they face on their journey to digitisation.

A very important measure for retaining and attracting talent is work incentives. Work incentives are compensations to the employee from the company for achieving certain objectives. This increases worker engagement, motivation, productivity and professional satisfaction.

As a result, companies in the sector are increasingly choosing to develop a work incentives programme, where they have previously studied and planned the appropriate and most suitable incentives, depending on the company and the type of employees, with the aim of motivating their workers to increase their production and improve their work results.

In the case of the communications sector, these measures will also increase company sales and profits. Within this sector, sales are made through distributors, agencies, internal sales and own stores, aimed both at individual customers and companies. That is why such importance is given to the sales force, leading to more highly motivated sales people with greater desire to give the best of themselves every day, so leading to improved company profits.

Furthermore, all the areas associated with sales, departments that enable, facilitate and ensure the healthiness of sales, as well as customer service, will be subject to incentives.

For an incentive system to be effective, it is essential for it to be well-defined, well-communicated, understandable and based on measurable, quantifiable, explicit and achievable objectives.

Work incentives may or may not be economic. For the employee, it needs to be something that recompenses or rewards them for their efforts. Only in that way will the incentives plan be effective.

Finally, once the incentives plan has been established, the company needs to assess it regularly, because in a changing environment such as the present, company objectives, employee motivations and the market will vary. To adapt to changes in the market and to the various internal and external circumstances, it will need to evolve over time.

What advantages do incentive systems offer telecoms companies?

Implementing an incentives plan in the company has numerous benefits for workers, but also for companies it:

  • Improves employee productivity
  • Attracts qualified professionals
  • Increases employee motivation
  • Assesses results
  • Encourages teamwork


In one of our telecoms clients, /bluetab
 has developed an internal business tool to calculate incentives for the various areas associated with sales. The work incentives are economic in this case, and performance assessment, associated with meeting their objectives, consists of an economic percentage of their salary. Achieving a series of objectives measures contribution to profitable company growth over a period of time.

The following factors are taken into account in developing the incentives calculation:

  • Policy: Definition and approval of the incentives policy for the various sales segments and channels by HR.
  • Objectives: Distribution of company objectives as spread across the various areas associated with sales.
  • Performance: Performance of the sales force and areas associated with sales over the periods defined previously in the policy.
  • Calculation: Calculation of performance and achievement of objectives, of all the profiles included in the incentive policy.
  • Payment: Addition of payment to the payroll for the corresponding performance-based incentives. Payments will be bimonthly, quarterly, semi-annual or annual.

How do we do it?

/bluetab develops tools for tracking the achievement of objectives and calculation of incentives. This allows everyone related to sales, to whom this model applies, to track their results, as well as the various departments related to their decision, human resources, sales managers, etc.

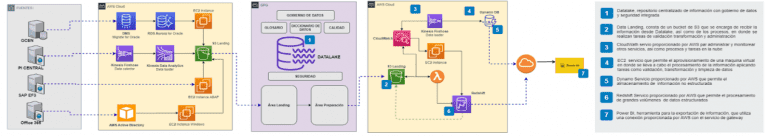
The most important thing in developing these types of tools is to analyse all the client’s needs, gather all the information necessary for calculating the incentives and fully understand the policy. We analyse and compile all the data sources needed for subsequent integration into a single repository.

The various data sources may be Excel, csv or txt files, the customer’s various information systems, such as Salesforce, offer configuration tools, database systems (Teradata, ORACLE, etc.). The important thing is to adapt to any environment in which the client works.

We typically use processes programmed in Python to extract from all the data sources automatically. We then integrate all the resulting files using ETL processes, performing all the necessary transformations and loading the transformed data into a database system as a single repository (e.g. Teradata).

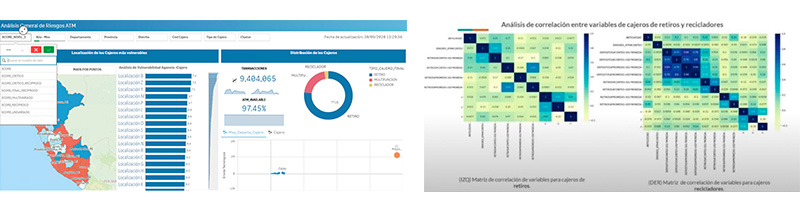
Finally, we connect the database to a data visualisation tool, such as Power BI. All the incentives calculations are implemented in that tool. Scorecards are then published to share this with the various users, providing security both at access and data protection levels.

As an added value, we include forecasts in two different ways. The first is based on data provided by the customer, reported in turn by the sales force. The second by integrating predictive analysis algorithms using Python, Anaconda, Spider, R which, based on a historical record of the various KPIs, enables estimation of future data with low margins of error. This allows for prediction of the results of future incentives.

Additionally, simulations of the various scenarios can be carried out, using parameters, for calculation of the objectives and achievement of incentives.

The/bluetab tool developed will enable departments affected by incentives to perform daily, weekly, monthly or yearly monitoring of their results in a flexible, dynamic, agile manner. As well as allowing the departments involved in the decisions to monitor the data, it will also enable them to improve future decision making.

Benefits provided by /bluetab

  • Centralisation of information, the chance to perform calculation and monitoring using a single tool.
  • Higher updating frequency: going from monthly and semi-annual updating in some cases to daily, weekly and real-time on occasions.
  • Reduction of 63% in time spent on manual calculation tasks.
  • Greater traceability and transparency.
  • Scalability and depersonalisation of reporting.
  • Errors from manual handling of multiple different sources reduced by 11%. Data quality.
  • Artificial intelligence simulating different scenarios.
  • Dynamic visualisation and monitoring of information.
  • Improved decision-making at the business level.
Do you want to know more about what we offer and to see other success stories?
DISCOVER BLUETAB

SOLUTIONS, WE ARE EXPERTS

DATA STRATEGY
DATA FABRIC
AUGMENTED ANALYTICS

You may be interested in

¿Cómo pueden las empresas asegurarse de que sus datos estén estructurados, escalables y disponibles cuando se necesiten?

septiembre 13, 2024
READ MORE

Leadership changes at Bluetab EMEA

abril 3, 2024
READ MORE

Data-Driven Agriculture; Applied Big Data, Cloud & AI

noviembre 4, 2020
READ MORE

¿Qué está pasando en el mundo de la AI?

marzo 6, 2023
READ MORE

Guía avanzada sobre almacenamiento en Snowflake

octubre 3, 2022
READ MORE

Snowflake, el Time Travel sin DeLorean para unos datos Fail-Safe.

febrero 23, 2023
READ MORE

Publicado en: Blog, tendencias

Cómo depurar una Lambda de AWS en local

octubre 8, 2020 by Bluetab

Cómo depurar una Lambda de AWS en local

Bluetab

AWS Lambda es un servicio serverless mediante el que se puede ejecutar código sin necesidad de levantar ni administrar máquinas. Se paga solamente por el tiempo consumido en la ejecución (15 minutos como máximo).

El servicio dispone de un IDE simple, pero por su propia naturaleza no permite añadir puntos de ruptura para depurar el código. Seguro que algunos de vosotros os habéis visto en esta situación y habéis tenido que hacer uso de métodos poco ortodoxos como prints o ejecutar el código directamente en vuestra máquina, pero esto último no reproduce las condiciones reales de ejecución del servicio.

Para permitir depurar con fiabilidad desde nuestro propio PC, AWS pone a disposición SAM (Serverless Application Model).

Instalación

Los requisitos necesarios son (se ha usado Ubuntu 18.04 LTS):

  • Python (2.7 ó >= 3.6)
  • Docker
  • IDE que se pueda enlazar a un puerto de debug (en nuestro caso usamos VS Code)
  • awscli


Para instalar la CLI de AWS SAM desde AWS recomiendan brew tanto para Linux como macOS, pero en este caso se ha optado por hacerlo con pip por homogeneidad:

python3 -m pip install aws-sam-cli 

Configuración y ejecución

1. Iniciamos un proyecto SAM

sam init 
  • Por simplicidad se selecciona “AWS Quick Start Templates” para crear un proyecto a través de plantillas predefinidas
  • Se elige la opción 9 – python3.6 como el lenguaje del código que contendrá nuestra lambda
  • Se selecciona la plantilla de “Hello World Example»

En este momento ya tenemos nuestro proyecto creado en la ruta especificada:

  • /helloworld: app.py con el código Python a ejecutar y requirements.txt con sus dependencias
  • /events: events.json con ejemplo de evento a enviar a la lambda para su ejecución. En nuestro caso el trigger será un GET a la API a http://localhost:3000/hello
  • /tests : test unitario
  • template.yaml: plantilla con los recursos de AWS a desplegar en formato YAML de CloudFormation. En esta aplicación de ejemplo sería un API gateway + lamba y se emulará ese despliegue localmente

2. Se levanta la API en local y se hace un GET al endpoint

sam local start-api 

Concretamente el endpoint de nuestro HelloWorld
será http://localhost:3000/hello Hacemos un GET

Y obtenemos la respuesta de la API

3. Añadimos la librería ptvsd (Python Tools for Visual Studio) para debugging a requirements.txt quedando como:

requests
ptvsd 

4. Habilitamos el modo debug en el puerto 5890 haciendo uso del siguiente código en helloworld/app.py

import ptvsd

ptvsd.enable_attach(address=('0.0.0.0', 5890), redirect_output=True)
ptvsd.wait_for_attach() 

Añadimos también en app.py dentro de la función lambda_handler varios prints para usar en la depuración

print('punto de ruptura')

print('siguiente línea')

print('continúa la ejecución')

return {
    "statusCode": 200,
    "body": json.dumps({
        "message": "hello world",
        # "location": ip.text.replace("\n", "")
    }),
} 

5. Aplicamos los cambios realizados y construimos el contenedor

sam build --use-container 

6. Configuramos el debugger de nuestro IDE

En VSCode se utiliza el fichero launch.json. Creamos en la ruta principal de nuestro proyecto la carpeta .vscode y dentro el fichero

{
  "version": "0.2.0",
  "configurations": [
      {
          "name": "SAM CLI Python Hello World",
          "type": "python",
          "request": "attach",
          "port": 5890,
          "host": "127.0.0.1",
          "pathMappings": [
              {
                  "localRoot": "${workspaceFolder}/hello_world",
                  "remoteRoot": "/var/task"
              }
          ]
      }
  ]
} 

7. Establecemos un punto de ruptura en el código en nuestro IDE

8. Levantamos nuestra aplicación con la API en el puerto de debug

sam local start-api --debug-port 5890 

9. Hacemos de nuevo un GET a la URL del endpoint http://localhost:3000/hello

10. Lanzamos la aplicación desde VSCode en modo debug, seleccionando la configuración creada en launch.json

Y ya estamos en modo debug, pudiendo avanzar desde nuestro punto de ruptura

Alternativa: Se puede hacer uso de events/event.json para lanzar la lambda a través de un evento definido por nosotros

En este caso lo modificamos incluyendo un solo parámetro de entrada:

{
   "numero": "1"
} 
Y el código de nuestra función para hacer uso del evento:
print('punto de ruptura número: ' + event["numero"]) 
De esta manera, invocamos a través del evento en modo debug:
sam local invoke HelloWorldFunction -d 5890 -e events/event.json 
Podemos ir depurando paso a paso, viendo como en este caso se hace uso del evento creado:
¿Quieres saber más de lo que ofrecemos y ver otros casos de éxito?
DESCUBRE BLUETAB

SOLUCIONES, SOMOS EXPERTOS

DATA STRATEGY
DATA FABRIC
AUGMENTED ANALYTICS

Te puede interesar

Empoderando a las decisiones en diversos sectores con árboles de decisión en AWS

junio 4, 2024
LEER MÁS

Potencia Tu Negocio con GenAI y GCP: Simple y para Todos

marzo 27, 2024
LEER MÁS

LakeHouse Streaming en AWS con Apache Flink y Hudi

abril 11, 2023
LEER MÁS

¿Cuánto vale tu cliente?

octubre 1, 2020
LEER MÁS

DataOps

octubre 24, 2023
LEER MÁS

Databricks sobre Azure – Una perspectiva de Arquitectura (parte 2)

marzo 24, 2022
LEER MÁS

Publicado en: Blog, Tech

How much is your customer worth?

octubre 1, 2020 by Bluetab

How much is your customer worth?

Bluetab

Our client is a multinational leader in the energy sector with investments in extraction, generation and distribution, with a significant presence in Europe and Latin America. It is currently developing business intelligence initiatives, exploiting its data with embedded solutions on cloud platforms. 

The problem it had was big because, to generate any use case, it needed to consult countless sources of information generated manually by various departments, including text files and spreadsheets, but not just that, it also had to use information systems ranging from Oracle DB to Salesforce. 

«The problem it had was big because, to generate any use case, it needed to consult countless sources of information generated manually»

The solution was clear; all the necessary information needed to be concentrated in a single, secure, continually available, organised and, above all, cost-efficient place. The decision was to implement a Data Lake in the AWS Cloud.

In project evolution, the client was concerned about the vulnerabilities of its local servers, where they have had some problems with service availability and even the a computer virus intrusion, for which /bluetab proposes to migrate the most critical processes completely to the cloud. These include a customer segmentation model, developed in R. 

Segmenting the customer portfolio requires an ETL developed in Python using Amazon Redshift as DWH, where a Big Data EMR cluster is also run on demand with tasks developed in Scala to handle large volumes of transaction information generated on a daily basis. The process results that were previously hosted and exploited from a MicroStrategy server now were developed in reports and dashboards using Power BI.

«…the new architecture design and better management of cloud services in their daily use enabled us to optimise cloud billing, reducing OPEX by over 50%»

Not only did we manage to integrate a significant quantity of business information into a centralised, governed repository, but the new architecture design and better management of cloud services in their daily use enabled us to optimise cloud billing, reducing OPEX by over 50%. Additionally, this new model enables accelerated development of any initiative requiring use of this data, thereby reducing project cost.

Now our customer wants to test and leverage the tools we put into their hands to answer a more complex question: how much are my customers worth?

Its traditional segmentation model in the distribution business was based primarily on an analysis of payment history and turnover. In this way they predict the possibility of defaults in new services, and the potential value of the customer in billing terms. All of this, crossed with financial statement information, still formed a model with ample room for improvement.

«At /bluetab we have experience in development of analytical models that ensure efficient and measurable application of the most suitable algorithms for each problem and each data set»

At /bluetab we have experience in development of analytical models that ensure efficient and measurable application of the most suitable algorithms for each problem and each data set, but the market now provides solutions as very mature analytical models that, with minimum parametrisation, enable good results while drastically reducing development time. As such, we used a well-proven CLV (Customer Lifetime Value) model to help our client evaluate the potential life-cycle value of its customers.

We have incorporated variables in the new scenario such as After-sales service costs (such as recovery management, CC incident resolution costs, intermediary billing agent costs, etc.), and Provisioning logistics costs into the customers’ income and expense data, making it possible to include data on geographical positioning for distribution costs, market maturity in terms of market share, or crossing with information provided by different market sources. This means our client can make better estimates of the value of its current and potential customers, and perform modelling and forecasting of profitability for new markets or new services.

The potential benefit from application of the analytical models depends on less “sexy” aspects, such as consistent organisation and governance of the data in the back office, the quality of the data provisioning the model, implementation of the model following DevOps best practices and constant communication with the client to ensure business alignment and to be able to extract/visualise conclusions of value from the information obtained. And at /bluetab we believe this is only possible with expert technical knowledge and a deep commitment to understanding our clients’ businesses.

«The potential benefit from application of the analytical models is only possible with expert technical knowledge and a deep commitment to understanding our clients’ businesses»

Do you want to know more about what we offer and to see other success stories?
DISCOVER BLUETAB

SOLUTIONS, WE ARE EXPERTS

DATA STRATEGY
DATA FABRIC
AUGMENTED ANALYTICS

You may be interested in

Algunas de las capacidades de Matillion ETL en Google Cloud

julio 11, 2022
READ MORE

Entrena y Despliega tu Modelo de Machine Learning en 15 Minutos con Databricks

junio 10, 2025
READ MORE

MICROSOFT FABRIC: Una nueva solución de análisis de datos, todo en uno

octubre 16, 2023
READ MORE

Big Data e IoT

febrero 10, 2021
READ MORE

Data Mesh

julio 27, 2022
READ MORE

La gestión del cambio: El puente entre las ideas y el éxito

febrero 5, 2025
READ MORE

Publicado en: Blog, tendencias

We have a Plan B

septiembre 17, 2020 by Bluetab

We have a Plan B

Bluetab

The Reto Pelayo Vida (Pelayo Life Challenge, an annual event for women survivors of cancer) sponsored by /bluetab, has always sought remote parts of the planet, distant locations and extraordinary landscapes, but the world is experiencing times we have not seen before, and the safety of those on the expedition must be ensured. So Plan B has been put into effect, in line with the circumstances:

The expedition will depart from Bilbao and, in three stages, will circumnavigate the entire peninsula, passing through the Strait and stopping in Malaga and Valencia to finish in Barcelona.

The Reto Pelayo Vida 2020 in numbers

nautical miles
+ 0 mil
candidates
0
Olympic champion
0
draught
0 m
feet in length
0
beam
0 m

For another year, in line with our Equality Plan, we bluetabbers are a vital support for these women

Do you want to know more about what we offer and to see other success stories?
DISCOVER BLUETAB

SOLUTIONS, WE ARE EXPERTS

DATA STRATEGY
DATA FABRIC
AUGMENTED ANALYTICS

You may be interested in

Gobierno del Dato: Una mirada en la realidad y el futuro

mayo 18, 2022
READ MORE

Usando los Grandes Modelos de Lenguaje en información privada

marzo 11, 2024
READ MORE

Databricks on Azure – An architecture perspective (part 2)

marzo 24, 2022
READ MORE

Mi experiencia en el mundo de Big Data – Parte II

febrero 4, 2022
READ MORE

Detección de Fraude Bancario con aprendizaje automático

septiembre 17, 2020
READ MORE

FinOps

mayo 20, 2024
READ MORE

Publicado en: Blog, Noticias

Bank Fraud detection with automatic learning II

septiembre 17, 2020 by Bluetab

Bank Fraud detection with automatic learning II

Bluetab

A model to catch them all!

The creation of descriptive and predictive models is based on statistics and recognising patterns in groups with similar characteristics. We have created a methodology that enables detection of anomalies using historical ATM channel transaction behaviour for one of the most important financial institutions in Latin America.

Together with the client and a group of statisticians and technology experts, we created a tool for audit processes that facilitates the detection of anomalies in the fronts that is most important and open to action for the business. From operational issues, availability issues and technology errors to internal or external fraud.

The ATM channel represents an area of business that is subject to direct contact with the public who use it, and is vulnerable for reasons such as connectivity and hardware faults. The number of daily transactions in a network of over 2,000 ATMs involves a huge number of indicators and metrics of technological and operational natures. Currently, a group of auditors is given the task of manually sampling and analysing this data stream to identify risks in the operation of the ATM channel.

The operational characteristics mean that the task of recognising patterns is different for each ATM, as the technology in each unit and the volume of transactions is influenced by factors such as the seasonal phenomenon, demography and even the economic status of the area. To tackle this challenge, /bluetab developed a framework around Python and SQL for segmentation of the most appropriate typologies according to variable criteria, and the detection of anomalies across a set of over 40 key indicators for channel operation. This involved unsupervised learning models and time series that enable us to differentiate between groups of comparable cash machines and achieve more accurate anomaly detection.

The purely mathematical results of this framework were condensed and translated into business-manageable vulnerability metrics, which we developed together with the end user in Qliksense. In this way, we handed the client an analysis environment that covers all the significant operational aspects, but which also enables incorporation of other scenarios on demand.

Now the auditors can analyse months of information considering the temporary market situation, geographic location or technological and transactional characteristics, where they previously only had the capacity to analyse samples.

We are working with our client to drive initiatives to incorporate technology and make the operation more efficient and speed up the response time in case of any incidents.

Do you want to know more about what we offer and to see other success stories?
DISCOVER BLUETAB

SOLUTIONS, WE ARE EXPERTS

DATA STRATEGY
DATA FABRIC
AUGMENTED ANALYTICS

You may be interested in

PERSONAL MAPS: conociéndonos más

octubre 24, 2023
READ MORE

Del negocio físico a la explosión del On-Line

abril 7, 2021
READ MORE

Data governance in the Contact Center services sector

septiembre 1, 2022
READ MORE

El futuro del Cloud y GenIA en el Next ’23

septiembre 19, 2023
READ MORE

MODELOS DE ENTREGA DE SERVICIOS EN LA NUBE

junio 27, 2022
READ MORE

Oscar Hernández, nuevo CEO de Bluetab LATAM

mayo 16, 2024
READ MORE

Publicado en: Blog, tendencias

Bank Fraud detection with automatic learning

septiembre 17, 2020 by Bluetab

Bank Fraud detection with automatic learning

Bluetab

The financial sector is currently immersed in a fight against bank fraud, with this being one of its biggest challenges. Spanish banking saw an increase of 17.7% in 2018 in claims for improper transactions or charges compared to the previous year and in 2017 alone there were over 123,064 on-line fraud incidents against companies and individuals.

The banking system is confronting the battle against fraud from a technological point of view. It is currently in the midst of a digitisation process and, with investments of around 4,000 million euros per year, it is putting its efforts into adoption of new technologies such as Big Data and Artificial Intelligence. These technologies are intended to improve and automate various processes, including detection and management of fraud.

At /bluetab we are undertaking a variety of initiatives within the technological framework of Big Data and Artificial Intelligence in the financial sector. Within the framework of our “Advanced Analytics & Machine Learning” initiatives, we are currently collaborating on Security and Fraud projects where, through the use of Big Data and Artificial Intelligence, we are able to help our clients create more accurate predictive models.

So, how can automatic learning help prevent bank fraud?. Focusing on collaborations within the fraud area, /bluetab addresses these types of initiatives based on a series of transfers identified as fraud and a data set with user sessions in electronic banking. The challenge is to generate a model that can predict when a session may be fraudulent by targeting the false positives and negatives that the model may produce.

Understanding the business and the data is critical to successful modelling.

In overcoming these kinds of technological challenges, we have noted how the use of a methodology is of vital importance in addressing these challenges. At /bluetab we make use of an in-house, ad-hoc adaptation for Banking of the CRISP-DM methodology in which we distinguish the following phases:

  • Understanding the business
  • Understanding the data
  • Data quality
  • Construction of intelligent predictors
  • Modelling


We believe that in On-line Fraud detection projects understanding the business and the data is of great importance for proper modelling. Good data analysis lets us observe how these are related to the target variable (fraud), as well as other statistical aspects (data distribution, search for outliers, etc.) which are of no less importance. You can note the presence in these analyses of variables with great predictive capacity, which we call “diamond variables”. Attributes such as the number of visits to the website, the device used for connection, the operating system or the browser used for the session (among others) are usually strongly related to bank fraud. In addition, the study of these variables shows that, individually, they can cover over 90% of fraudulent transactions. That is, analysing and understanding the business and the data enables you to evaluate the best way of approaching a solution without getting lost in a sea of data.

Once you have the understanding of the business and the data and after having obtained those variables with greater predictive power, it is essential to have tools and processes that ensure the quality of those variables. Training the predictive models with reliable variables and historical data is indispensable. Training with low-quality variables could lead to erratic models with great impacts within the business.

After ensuring the reliability of the selected predictor variables, the next step is to construct intelligent predictor variables. Even though these variables, selected in the previous steps, have a strong relationship with the variable to be predicted (target), they can result in certain problems in behaviour when modelling, which is why data preparation is necessary. This data preparation involves making certain adaptations to the variables to be used within the algorithm, such as the handling of nulls or of categorical variables. Additionally, proper handling of the outliers identified in the previous steps must be performed to avoid including information that could distort the model.

With the aim of “tuning” the result, it is similarly of vital importance to apply various transformations to the variables to improve the model’s predictive value. Basic mathematical transformations such as exponential, logarithmic or standardisation, together with more complex transformations such as WoE, make it possible to substantially improve the quality of the predictive models thanks to the use of more highly processed variables, facilitating the task of the model.

Finally, the modelling stage focuses on confronting different types of algorithms with different hyperparameter configurations to get to the model that generates the best prediction. This is where tools such as Spark help to a great extent, by being able to carry out training of different algorithms and configurations quickly, thanks to distributed programming.

For sustainability of your application and to avoid model obsolescence, this methodology needs to be followed monthly in each use case and more frequently when dealing with an initiative such as bank fraud. This is because new forms of fraud may arise that are not covered by the trained models. This means it is important to understand and to select the variables with which to retrain the models so that they do not become obsolete over time, which could seriously harm the business.

In summary, a good working methodology is vital when addressing problems within the world of Artificial Intelligence and Advanced Analytics, with phases for understanding the business and the data being essential. Having specialised internal tools to enable these types of projects to be executed in just a few weeks is now a must, to generate quick wins for our clients and their business.

Do you want to know more about what we offer and to see other success stories?
DISCOVER BLUETAB

SOLUTIONS, WE ARE EXPERTS

DATA STRATEGY
DATA FABRIC
AUGMENTED ANALYTICS

You may be interested in

Bluetab en la ElixirConfEU 2023

mayo 3, 2023
READ MORE

Análisis de vulnerabilidades en contenedores con trivy

marzo 22, 2024
READ MORE

5 errores comunes en Redshift

diciembre 15, 2020
READ MORE

Desplegando una plataforma CI/CD escalable con Jenkins y Kubernetes

septiembre 22, 2021
READ MORE

Espiando a tu kubernetes con kubewatch

septiembre 14, 2020
READ MORE

Bluetab se incorporará a IBM

julio 9, 2021
READ MORE

Publicado en: Blog, tendencias

  • « Ir a la página anterior
  • Página 1
  • Páginas intermedias omitidas …
  • Página 7
  • Página 8
  • Página 9
  • Página 10
  • Ir a la página siguiente »

Footer

LegalPrivacidadPolítica de cookies
LegalPrivacy Cookies policy

Patrono

Patron

Sponsor

Patrocinador

© 2025 Bluetab Solutions Group, SL. All rights reserved.