• Saltar a la navegación principal
  • Saltar al contenido principal
  • Saltar al pie de página
Bluetab

Bluetab

an IBM Company

  • Soluciones
    • DATA STRATEGY
    • DATA READINESS
    • DATA PRODUCTS AI
  • Assets
    • TRUEDAT
    • FASTCAPTURE
    • Spark Tune
  • Conócenos
  • Oficinas
    • España
    • Mexico
    • Perú
    • Colombia
  • talento
    • España
    • TALENT HUB BARCELONA
    • TALENT HUB BIZKAIA
    • TALENT HUB ALICANTE
    • TALENT HUB MÁLAGA
  • Blog
  • English

Bluetab

Espiando a tu kubernetes con kubewatch

septiembre 14, 2020 by Bluetab

Espiando a tu Kubernetes con Kubewatch

Bluetab

Desde la Práctica Cloud queremos impulsar la adopción de la nube como forma de trabajo en el mundo de IT. Para ayudar en esta tarea, vamos a publicar multitud de artículos de buenas prácticas y casos de uso, otros hablarán aquellos servicios clave dentro de la nube.

En esta ocasión hablaremos de Kubewatch.

¿Qué es Kubewath?

Kubewatch es una utilidad desarrollada por Bitnami Labs que permite el envío de notificaciones a distintos sistemas de comunicación.

Los webhooks soportados son:

  • Slack
  • Hipchat
  • Mattermost
  • Flock
  • Webhook
  • Smtp

Integración de kubewatch con Slack

Las imágenes disponibles están publicadas en el GitHub de bitnami/kubewatch

Si queréis, podéis descargaros la última versión para probarla en vuestro entorno local:

$ docker pull bitnami/kubewatch 

Una vez dentro del contenedor podéis jugar con las opciones:

$ kubewatch -h

Kubewatch: A watcher for Kubernetes

kubewatch is a Kubernetes watcher that publishes notifications
to Slack/hipchat/mattermost/flock channels. It watches the cluster
for resource changes and notifies them through webhooks.

supported webhooks:
 - slack
 - hipchat
 - mattermost
 - flock
 - webhook
 - smtp

Usage:
  kubewatch [flags]
  kubewatch [command]

Available Commands:
  config      modify kubewatch configuration
  resource    manage resources to be watched
  version     print version

Flags:
  -h, --help   help for kubewatch

Use "kubewatch [command] --help" for more information about a command. 

¿De qué tipos de recursos podemos obtener notificaciones?

  • Deployments
  • Replication controllers
  • ReplicaSets
  • DaemonSets
  • Services
  • Pods
  • Jobs
  • Secrets
  • ConfigMaps
  • Persistent volumes
  • Namespaces
  • Ingress controllers

¿Cuándo recibiremos una notificación?

En cuanto haya una acción sobre algún objeto de kubernetes, así como creación, destrucción o actualización.

Configuración

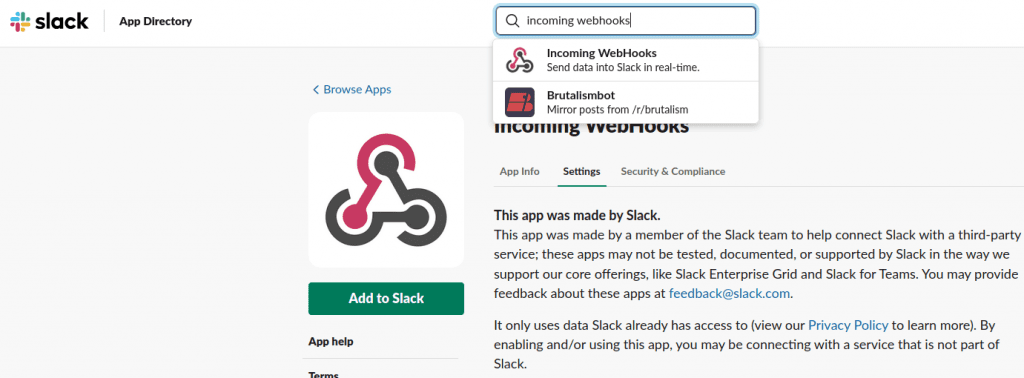
En primer lugar, crearemos un canal de slack y le asociaremos un webhook. Para ello, iremos a la sección de Apps de Slack, buscaremos “Incoming WebHooks” y pulsaremos “Add to Slack”:

En el caso de no tener aún un canal creado para este propósito daremos de alta uno nuevo:

En este ejemplo, el canal a crear se llamará “k8s-notifications”. Posteriormente debemos configurar el webhook, yendo para ello al panel de “Incoming WebHooks” y añadiendo una nueva configuración donde tendremos que seleccionar el nombre del canal al que queremos enviar notificaciones. Una vez seleccionado, la configuración nos devolverá una «Webhook URL» que será la que utilicemos para configurar Kubewatch. Opcionalmente, tenemos la posibilidad de seleccionar el icono (opción «Customize Icon») con el que visualizaremos la recepción de eventos y el nombre con el que llegarán (opción “Customize Name”).

En este punto ya estamos listos para configurar los recursos de kubernetes. En el GitHub de Kubewatch tenemos algunos ejemplos de manifiestos y también la opción de instalación por Helm. Sin embargo, aquí construiremos los nuestros propios.

En primer lugar, crearemos un fichero “kubewatch-configmap.yml” con el ConfigMap que servirá para configurar el contenedor de kubewatch:

apiVersion: v1
kind: ConfigMap
metadata:
  name: kubewatch
data:
  .kubewatch.yaml: |
    handler:
      webhook:
        url: https://hooks.slack.com/services/<your_webhook>
    resource:
      deployment: true
      replicationcontroller: true
      replicaset: false
      daemonset: true
      services: true
      pod: false
      job: false
      secret: true
      configmap: true
      persistentvolume: true
      namespace: false 

Simplemente tendremos que activar con “true” o desactivar con «false» los tipos de recursos sobre los que queremos recibir notificaciones. Asimismo, establecemos la url del Incomming Webhook que dimos de alta previamente.

Ahora, para que nuestro contenedor tenga acceso a los recursos de kubernetes a través de su api vamos a dar de alta el fichero “kubewatch-service-account.yml” con un Service Account, un Cluster Role y un Cluster Role Binding:

kind: ClusterRole
apiVersion: rbac.authorization.k8s.io/v1
metadata:
  name: kubewatch
rules:
- apiGroups: ["*"]
  resources: ["pods", "pods/exec", "replicationcontrollers", "namespaces", "deployments", "deployments/scale", "services", "daemonsets", "secrets", "replicasets", "persistentvolumes"]
  verbs: ["get", "watch", "list"]
---
apiVersion: v1
kind: ServiceAccount
metadata:
  name: kubewatch
  namespace: default
---
apiVersion: rbac.authorization.k8s.io/v1beta1
kind: ClusterRoleBinding
metadata:
  name: kubewatch
roleRef:
  apiGroup: rbac.authorization.k8s.io
  kind: ClusterRole
  name: kubewatch
subjects:
  - kind: ServiceAccount
    name: kubewatch
    namespace: default 

Por último, crearemos un fichero “kubewatch.yml” para desplegar la aplicación:

apiVersion: v1
kind: Pod
metadata:
  name: kubewatch
  namespace: default
spec:
  serviceAccountName: kubewatch
  containers:
  - image: bitnami/kubewatch:0.0.4
    imagePullPolicy: Always
    name: kubewatch
    envFrom:
      - configMapRef:
          name: kubewatch
    volumeMounts:
    - name: config-volume
      mountPath: /opt/bitnami/kubewatch/.kubewatch.yaml
      subPath: .kubewatch.yaml
  - image: bitnami/kubectl:1.16.3
    args:
      - proxy
      - "-p"
      - "8080"
    name: proxy
    imagePullPolicy: Always
  restartPolicy: Always
  volumes:
  - name: config-volume
    configMap:
      name: kubewatch
      defaultMode: 0755 

Vemos que el valor de la clave “mountPath” será la ruta del fichero donde se escribirá la configuración de nuestro ConfigMap dentro del contenedor (/opt/bitnami/kubewatch/.kubewatch.yaml). Podemos ampliar aquí la información sobre cómo montar configuraciones en kubernetes. En este ejemplo, vemos que nuestro despliegue del aplicativo será a través de un único pod. Evidentemente, en un sistema productivo tendríamos que definir un Deployment con el número de réplicas que consideremos convenientes para tenerlo así siempre activo, aun en caso de pérdida del pod.

Una vez listos los manifiestos vamos a aplicarlos a nuestro clúster:

$ kubectl apply  -f kubewatch-configmap.yml -f kubewatch-service-account.yml -f kubewatch.yml 

En unos pocos segundos tendremos listo el servicio:

$ kubectl get pods |grep -w kubewatch

kubewatch                                  2/2     Running     0          1m 

El pod de kubewatch tiene asociado dos contenedores: kubewatch y kube-proxy, este último para atacar a la API.

$   kubectl get pod kubewatch  -o jsonpath='{.spec.containers[*].name}'

kubewatch proxy 

Verificamos a través de los logs que ambos contenedores han levantado correctamente y sin mensajes de error:

$ kubectl logs kubewatch kubewatch

==> Config file exists...
level=info msg="Starting kubewatch controller" pkg=kubewatch-daemonset
level=info msg="Starting kubewatch controller" pkg=kubewatch-service
level=info msg="Starting kubewatch controller" pkg="kubewatch-replication controller"
level=info msg="Starting kubewatch controller" pkg="kubewatch-persistent volume"
level=info msg="Starting kubewatch controller" pkg=kubewatch-secret
level=info msg="Starting kubewatch controller" pkg=kubewatch-deployment
level=info msg="Starting kubewatch controller" pkg=kubewatch-namespace
... 
$ kubectl logs kubewatch proxy

Starting to serve on 127.0.0.1:8080 

Podríamos igualmente acceder al contenedor de kubewatch para probar la cli, ver la configuración, etcétera:

$  kubectl exec -it kubewatch -c kubewatch /bin/bash 

¡Ya tenemos listo nuestro notificador de eventos!

Ahora toca probar. Utilizaremos, por ejemplo, la creación de un deployment para testear el correcto funcionamiento:

$ kubectl create deployment nginx-testing --image=nginx
$ kubectl logs -f  kubewatch kubewatch

level=info msg="Processing update to deployment: default/nginx-testing" pkg=kubewatch-deployment 

Los logs ya nos avisan que se ha detectado el nuevo evento, así que vamos a nuestro canal de slack para verificarlo:

¡El evento ha sido notificado correctamente!

Ya podemos eliminar el deployment de prueba:

$ kubectl delete deploy nginx-testing 

Conclusiones

Evidentemente, Kubewatch no suple a los sistemas básicos de alerta y monitorización que todo orquestador productivo debe mantener, pero nos proporciona una manera fácil y eficaz de ampliar nuestro control sobre la creación y modificación de los recursos en kubernetes. En este caso de ejemplo, hemos realizado una configuración de kubewatch transversal a todo el clúster, “espiando” todo tipo de eventos, algunos quizá inservibles si mantenemos una plataforma como servicio, pues nos enteraríamos de cada uno de los pods creados, eliminados o actualizados por cada equipo de desarrollo en su propio namespace, lo cual es usual, legítimo y no aporta valor. Quizá sea más conveniente filtrar por los namespaces sobre cual queremos recibir notificaciones, como por ejemplo de kube-system, que es donde albergaremos generalmente nuestros servicios administrativos y donde solo los administradores deben tener acceso. En ese caso, simplemente tendremos que especificar el namespace en nuestro ConfigMap:

apiVersion: v1
kind: ConfigMap
metadata:
  name: kubewatch
data:
  .kubewatch.yaml: |
    namespace: "kube-system"
    handler:
      webhook:
        url: https://hooks.slack.com/services/<your_webhook>
    resource:
      deployment: true
      replicationcontroller: true
      replicaset: false 

Otra utilidad interesante puede ser “escuchar” a nuestro clúster tras un ajuste signicativo de la configuración como, por ejemplo, de nuestra estrategia de autoescalado, herramientas de integración, etcétera, pues siempre nos notificará los scale up y scale down, pudiendo ser interesante sobre todo en un momento inicial. En definitiva, Kubewatch amplía el control sobre los clústeres, siendo nosotros quienes decidamos el alcance que le damos. En sucesivos artículos veremos cómo gestionar los logs y las métricas de forma productiva.

¿Quieres saber más de lo que ofrecemos y ver otros casos de éxito?
DESCUBRE BLUETAB

SOLUCIONES, SOMOS EXPERTOS

DATA STRATEGY
DATA FABRIC
AUGMENTED ANALYTICS

Te puede interesar

Empoderando a las decisiones en diversos sectores con árboles de decisión en AWS

junio 4, 2024
LEER MÁS

Serverless Microservices

octubre 14, 2021
LEER MÁS

¿Existe el Azar?

noviembre 10, 2021
LEER MÁS

Los Incentivos y el Desarrollo de Negocio en las Telecomunicaciones

octubre 9, 2020
LEER MÁS

MICROSOFT FABRIC: Una nueva solución de análisis de datos, todo en uno

octubre 16, 2023
LEER MÁS

Snowflake: Zero-Copy clone, o cómo librarte del duplicado de datos al clonar.

marzo 22, 2023
LEER MÁS

Publicado en: Blog, Practices, Tech

Spying on your Kubernetes with Kubewatch

septiembre 14, 2020 by Bluetab

Spying on your Kubernetes with Kubewatch

Bluetab

At Cloud Practice we aim to encourage adoption of the cloud as a way of working in the IT world. To help with this task, we are going to publish numerous good practice articles and use cases and others will talk about those key services within the cloud.

This time we will talk about Kubewatch.

What is Kubewatch?

Kubewatch is a utility developed by Bitnami Labs that enables notifications to be sent to various communication systems.

Supported webhooks are:

  • Slack
  • Hipchat
  • Mattermost
  • Flock
  • Webhook
  • Smtp

Kubewatch integration with Slack

The available images are published in the bitnami/kubewatch GitHub

You can download the latest version to test it in your local environment:

$ docker pull bitnami/kubewatch 

Once inside the container, you can play with the options:

$ kubewatch -h

Kubewatch: A watcher for Kubernetes

kubewatch is a Kubernetes watcher that publishes notifications
to Slack/hipchat/mattermost/flock channels. It watches the cluster
for resource changes and notifies them through webhooks.

supported webhooks:
 - slack
 - hipchat
 - mattermost
 - flock
 - webhook
 - smtp

Usage:
  kubewatch [flags]
  kubewatch [command]

Available Commands:
  config      modify kubewatch configuration
  resource    manage resources to be watched
  version     print version

Flags:
  -h, --help   help for kubewatch

Use "kubewatch [command] --help" for more information about a command. 

For what types of resources can you get notifications?

  • Deployments
  • Replication controllers
  • ReplicaSets
  • DaemonSets
  • Services
  • Pods
  • Jobs
  • Secrets
  • ConfigMaps
  • Persistent volumes
  • Namespaces
  • Ingress controllers

When will you receive a notification?

As soon as there is an action on a Kubernetes object, as well as creation, destruction or updating.

Configuration

Firstly, create a Slack channel and associate a webhook with it. To do this, go to the Apps section of Slack, search for “Incoming WebHooks” and press “Add to Slack”:

If there is no channel created for this purpose, register a new one:

In this example, the channel to be created will be called “k8s-notifications”. Then you have to configure the webhook at the “Incoming WebHooks” panel and adding a new configuration where you will need to select the name of the channel to which you want to send notifications. Once selected, the configuration will return a ”Webhook URL” that will be used to configure Kubewatch. Optionally, you can select the icon (“Customize Icon” option) that will be shown on the events and the name with which they will arrive (“Customize Name” option).

You are now ready to configure the Kubernetes resources. There are some example manifests and also the option of installing by Helm on the Kubewatch GitHub However, here we will build our own.

First, create a file “kubewatch-configmap.yml” with the ConfigMap that will be used to configure the Kubewatch container:

apiVersion: v1
kind: ConfigMap
metadata:
  name: kubewatch
data:
  .kubewatch.yaml: |
    handler:
      webhook:
        url: https://hooks.slack.com/services/<your_webhook>
    resource:
      deployment: true
      replicationcontroller: true
      replicaset: false
      daemonset: true
      services: true
      pod: false
      job: false
      secret: true
      configmap: true
      persistentvolume: true
      namespace: false 

You simply need to enable the types of resources on which you wish to receive notifications with “true” or disable them with “false”. Also set the url of the Incoming WebHook registered previously.

Now, for your container to have access the Kubernetes resources through its api, register the “kubewatch-service-account.yml” file with a Service Account, a Cluster Role and a Cluster Role Binding:

kind: ClusterRole
apiVersion: rbac.authorization.k8s.io/v1
metadata:
  name: kubewatch
rules:
- apiGroups: ["*"]
  resources: ["pods", "pods/exec", "replicationcontrollers", "namespaces", "deployments", "deployments/scale", "services", "daemonsets", "secrets", "replicasets", "persistentvolumes"]
  verbs: ["get", "watch", "list"]
---
apiVersion: v1
kind: ServiceAccount
metadata:
  name: kubewatch
  namespace: default
---
apiVersion: rbac.authorization.k8s.io/v1beta1
kind: ClusterRoleBinding
metadata:
  name: kubewatch
roleRef:
  apiGroup: rbac.authorization.k8s.io
  kind: ClusterRole
  name: kubewatch
subjects:
  - kind: ServiceAccount
    name: kubewatch
    namespace: default 

Finally, create a “kubewatch.yml” file to deploy the application:

apiVersion: v1
kind: Pod
metadata:
  name: kubewatch
  namespace: default
spec:
  serviceAccountName: kubewatch
  containers:
  - image: bitnami/kubewatch:0.0.4
    imagePullPolicy: Always
    name: kubewatch
    envFrom:
      - configMapRef:
          name: kubewatch
    volumeMounts:
    - name: config-volume
      mountPath: /opt/bitnami/kubewatch/.kubewatch.yaml
      subPath: .kubewatch.yaml
  - image: bitnami/kubectl:1.16.3
    args:
      - proxy
      - "-p"
      - "8080"
    name: proxy
    imagePullPolicy: Always
  restartPolicy: Always
  volumes:
  - name: config-volume
    configMap:
      name: kubewatch
      defaultMode: 0755 

You will see that the value of the “mountPath” key will be the file path where the configuration of your ConfigMap will be written within the container (/opt/bitnami/kubewatch/.kubewatch.yaml). You can expand the information on how to mount configurations in Kubernetes here. In this example, you can see that our application deployment will be through a single pod. Obviously, in a production system you would need to define a Deployment with the number of replicas considered appropriate to keep it active, even in case of loss of the pod.

Once the manifests are ready apply them to your cluster:

$ kubectl apply  -f kubewatch-configmap.yml -f kubewatch-service-account.yml -f kubewatch.yml 

The service will be ready in a few seconds:

$ kubectl get pods |grep -w kubewatch

kubewatch                                  2/2     Running     0          1m 

The Kubewatch pod has two containers associated: Kubewatch and kube-proxy, the latter to connect to the API.

$   kubectl get pod kubewatch  -o jsonpath='{.spec.containers[*].name}'

kubewatch proxy 

Check through the logs that the two containers have started up correctly and without error messages:

$ kubectl logs kubewatch kubewatch

==> Config file exists...
level=info msg="Starting kubewatch controller" pkg=kubewatch-daemonset
level=info msg="Starting kubewatch controller" pkg=kubewatch-service
level=info msg="Starting kubewatch controller" pkg="kubewatch-replication controller"
level=info msg="Starting kubewatch controller" pkg="kubewatch-persistent volume"
level=info msg="Starting kubewatch controller" pkg=kubewatch-secret
level=info msg="Starting kubewatch controller" pkg=kubewatch-deployment
level=info msg="Starting kubewatch controller" pkg=kubewatch-namespace
... 
$ kubectl logs kubewatch proxy

Starting to serve on 127.0.0.1:8080 

You could also access the Kubewatch container to test the cli, view the configuration, etc.:

$  kubectl exec -it kubewatch -c kubewatch /bin/bash 

Your event notifier is now ready!

Now you need to test it. Let’s use the creation of a deployment as an example to test proper operation:

$ kubectl create deployment nginx-testing --image=nginx
$ kubectl logs -f  kubewatch kubewatch

level=info msg="Processing update to deployment: default/nginx-testing" pkg=kubewatch-deployment 

The logs now alert you that the new event has been detected, so go to your Slack channel to confirm it:

The event has been successfully reported!

Now you can eliminate the test deployment:

$ kubectl delete deploy nginx-testing 

Conclusions

Obviously, Kubewatch does not replace the basic warning and monitoring systems that all production orchestrators need to maintain, but it does provide an easy and effective way to extend control over the creation and modification of resources in Kubernetes. In this example case we performed a Kubewatch configuration across the whole cluster, “spying” on all kinds of events, some of which are perhaps useless if the platform is maintained as a service, as we would be aware of each of the pods created, removed or updated by each development team in its own namespace, which is common, legitimate and does not add value. It may be more appropriate to filter by the namespaces for which you wish to receive notifications, such as kube-system, which is where we generally host administrative services and where only administrators should have access. In that case, you would simply need to specify the namespace in your ConfigMap:

apiVersion: v1
kind: ConfigMap
metadata:
  name: kubewatch
data:
  .kubewatch.yaml: |
    namespace: "kube-system"
    handler:
      webhook:
        url: https://hooks.slack.com/services/<your_webhook>
    resource:
      deployment: true
      replicationcontroller: true
      replicaset: false 

Another interesting utility may be to “listen” to our cluster after a significant configuration adjustment, such as our self-scaling strategy, integration tools and so on, as it will always notify us of the scale ups and scale downs, which could be especially useful initially. In short, Kubewatch extends control over clusters, and we decide the scope we give it. In later articles we will look at how to manage logs and metrics productively.

Do you want to know more about what we offer and to see other success stories?
DISCOVER BLUETAB

SOLUTIONS, WE ARE EXPERTS

DATA STRATEGY
DATA FABRIC
AUGMENTED ANALYTICS

You may be interested in

Gobierno del Dato: Una mirada en la realidad y el futuro

mayo 18, 2022
READ MORE

Hashicorp Boundary

diciembre 3, 2020
READ MORE

Bluetab se incorporará a IBM

julio 9, 2021
READ MORE

Mitos y verdades de los ingenieros de software

junio 13, 2022
READ MORE

5 errores comunes en Redshift

diciembre 15, 2020
READ MORE

DataOps

octubre 24, 2023
READ MORE

Publicado en: Blog, Practices, Tech

Servicio de Inteligencia artificial para la lectura de documentos no estructurados

septiembre 11, 2020 by Bluetab

Servicio de Inteligencia artificial para la lectura de documentos no estructurados

Proporcionamos un servicio BPaaS (Business Process as a Service) para una de las instituciones financieras líderes en innovación y tecnología en el mercado español. Realizamos la clasificación de decenas de tipologías de documentos no estructurados de los que además se extraen hasta 10 datos diferentes. Con un acierto superior al 98% en la clasificación de documentos y superior a un 90% en la extracción de información. 

Nuestra tecnología realiza un preprocesamiento de la documentación para posteriormente extraer tanto el texto como distintas características del documento para clasificarla más adelante mediante mecanismos de aprendizaje automático. Posteriormente se extraen los datos relevantes según la tipología documental utilizando tareas de identificación y categorización de información clave de entidades en texto mediante el uso de modelos sofisticados basados en redes neuronales y otros mecanismos de aprendizaje automático.

QR code screenshot

La solución se integra de forma transparente en los flujos de trabajo ya existentes en el cliente, dotando a sus equipos de backoffice de una capacidad de procesamiento excepcional, reduciendo los tiempos de procesamiento, mejorando la calidad y abaratando los costes de estos equipos.

Nuestro enfoque se basa en la solución FastCapture propia de Bluetab la cual adaptamos a los casos de uso y casuísticas propias del servicio prestado a cada cliente. El despliegue de la solución se realiza mediante microservicios en un cluster Kubernetes en EKS que nos permite adaptar el tamaño de la infraestructura de procesamiento de manera elástica; nuestro software se desarrolla mediante lenguajes de programación Elixir, usando Phoenix Framework y React en las interfaces de usuario y Python, Keras y TensorFlow entre otros mecanismos de Machine Learning.

CASOS DE ÉXITO

Publicado en: Casos Etiquetado como: fastcapture

Artificial Intelligence service for reading unstructured documents

septiembre 11, 2020 by Bluetab

Artificial Intelligence service for reading unstructured documents

We carry out BPaaS Service (Business Process as a Service) for one of the leading financial institutions in innovation and technology in the Spanish market. We classify dozens of types of unstructured documents from which up to 10 different data are also extracted. With a success rate of more than 98% in document classification and more than 90% in the extraction of information.

Our technology performs a preprocessing of the documentation to later extract both the text and different characteristics of the document to classify it later using machine learning mechanisms. Subsequently, the relevant data are extracted according to the documentary typology using tasks of identification and categorization of key information of entities in text through the use of sophisticated models based on neural networks and other machine learning mechanisms.

The solution is seamlessly integrated into the client’s existing workflows, providing their back office teams with exceptional processing capacity, reducing processing times, improving quality and lowering the costs of these teams.

Our approach is based on Bluetab’s own FastCapture solution, which we adapt to the use cases and casuistry of the service provided to each client. The deployment of the solution is carried out through microservices in a Kubernetes cluster in EKS that allows us to adapt the size of the processing infrastructure in an elastic way; our software is developed using Elixir programming languages, using Phoenix Framework and React in the user interfaces and Python, Keras and TensorFlow among other Machine Learning mechanisms.

SUCCESS STORIES

Publicado en: Casos Etiquetado como: fastcapture

Truedat en Utilities

septiembre 11, 2020 by Bluetab

Truedat en Utilities

Nuestro cliente es una multinacional referente del sector de la energía con inversiones en extracción, generación y distribución, con importante implantación en Europa y Latinoamérica. 

Desde Bluetab hemos apoyado a nuestro cliente en el proceso de transformación digital que están abordando gracias a nuestra solución tecnológica Truedat que permite hacer una gestión integral de los procesos de gobierno del dato en entornos de Data Lake. La solución ha permitido al cliente comenzar a catalogar sus datos en los nuevos entornos digitales, generar un glosario de negocio global y mejorar en las actividades de calidad y perfilado de datos,

El alcance de la solución debía permitir trabajar con tecnologías cloud, principalmente serverless AWS, y poder incorporar nuestra solución truedat en un entorno tecnológico muy avanzado.

woman placing sticky notes on wall

CASOS DE ÉXITO

Publicado en: Casos Etiquetado como: truedat

Truedat in Utilities

septiembre 11, 2020 by Bluetab

Truedat in Utilities

Our client is a leading multinational in the energy sector with investments in extraction, generation and distribution, with a significant presence in Europe and Latin America.

From Bluetab we have supported our client in the digital transformation process that they are addressing thanks to our Truedat technological solution that enables comprehensive management of data governance processes in Data Lake environments. The solution has allowed the client to start redirecting their data in the new digital environments, to generate a global business glossary and to improve in the Quality and data profiling activities.

The scope of the solution had to allow us to work with cloud technologies, mainly serverless AWS, and to be able to incorporate our Truedat solution in a very advanced technological environment.

SUCCESS STORIES

Publicado en: Casos Etiquetado como: truedat

  • « Ir a la página anterior
  • Página 1
  • Páginas intermedias omitidas …
  • Página 26
  • Página 27
  • Página 28
  • Página 29
  • Página 30
  • Páginas intermedias omitidas …
  • Página 41
  • Ir a la página siguiente »

Footer

LegalPrivacidadPolítica de cookies
LegalPrivacy Cookies policy

Patrono

Patron

Sponsor

Patrocinador

© 2025 Bluetab Solutions Group, SL. All rights reserved.