• Skip to primary navigation
  • Skip to main content
  • Skip to footer
Bluetab

Bluetab

an IBM Company

  • SOLUTIONS
    • DATA STRATEGY
    • Data Readiness
    • Data Products AI
  • Assets
    • TRUEDAT
    • FASTCAPTURE
    • Spark Tune
  • About Us
  • Our Offices
    • Spain
    • Mexico
    • Peru
    • Colombia
  • talent
    • Spain
    • TALENT HUB BARCELONA
    • TALENT HUB BIZKAIA
    • TALENT HUB ALICANTE
    • TALENT HUB MALAGA
  • Blog
  • EN
    • ES

Practices

Hashicorp Boundary

December 3, 2020 by Bluetab

Hashicorp Series Boundary

Javier Pérez

DevOps Engineer

Javier Rodriguez

Cloud DevOps

Jorge de Diego

Cloud DevOps Engineer

After the last HashiConf Digital, the Cloud Practice wants to present you one of the main innovations that were presented: Boundary. In this post we are going to discuss what offers this new tool, why it is interesting, what we have found and how we have tested it.

What is Hashicorp Boundary?

Hashicorp Boundary is, as themselves claim, a tool that allows access any system using identity as a fundamental piece. What does this really mean?
Traditionally, when a user acquires the permission to access a remote service, he or she also gets explicit permission to the network where the service resides. However, Boundary, following the minimum privilege principle, provides us with an identity-based system for users who need access to applications or machines. For example, it is an easy way of access to a server via SSH using ephemeral keys as authentication method.

This means that Boundary limits what resources you can connect to and also manages the different permissions and accesses to resources with an authentication.

It is especially interesting because in the future it will be marked by the strong integration that it will have with other Hashicorp tools, especially Vault for credentials management and audit capabilities.

In case you are curious, Hashicorp has released the source code of Boundary which you have available at Github and the official documentation can be read on their website:
boundaryproject.

How have we tested Boundary?

BBased on an example project from Hashicorp, we have developed a small proof of concept that deploys Boundary in a hybrid-cloud scenario in AWS and GCP. Although the reference architecture does not said nothing about this design, we wanted to complete the picture and
set up a small multi-cloud stage to see how this new product.

The final architecture in broad terms is:

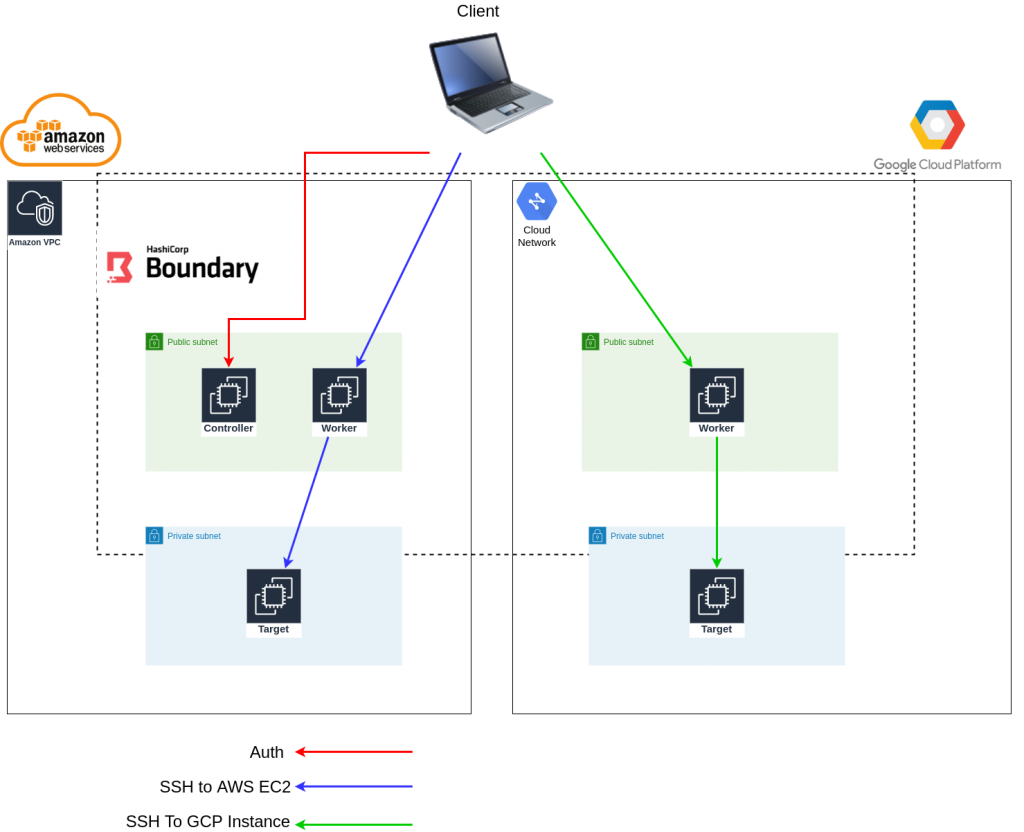
Once the infrastructure has been deployed and the application configured, we have tested connecting to the instances through SSH. All the source code is based on terraform 0.13 and you can find it in Bluetab-boundary-hybrid-architecture, where you will also find a detailed README that specifies the actions you have to follow to reproduce the environment, in particular:

  • Authentication with your user (previously configured) in Boundary. To accomplish this, you have to set the Boundary controllers endpoint and execute the following command: boundary authenticate.
  • Execute: boundary connect ssh with the required parameters to point to the selected target (this target represents one or more instances or endpoints)

In this particular scenario, the target is composed by two different machines:
one in AWS and one in GCP. If Boundary is not told which particular instance you want to access from that target, it will provide access to one of them randomly. Automatically, once you have selected the machine you want to access, Boundary will route the request to the appropriate worker, who has access to that machine.

What did we like?

  • The ease of configuration. Boundary knows exactly which worker has to address the request taking into account which service or machine is being requested.
    As the entire deployment (both infrastructure and application) has been done using terraform, the output of one deployment serves as the input of the other and everything is perfectly integrated.

  • It offers both graphic interface and CLI access. Despite being in a very early stage of development, the same binary includes (when configured as controller) a very clean graphical interface, in the same style as the rest of the Hashicorp tools. However, as not all functionality is currently implemented through the interface it is necessary to make configuration using the CLI.

What would we have liked to see?

  • Integration with Vault and indentity providers (IdPs) is still in the roadmap and until next versions it is not sure that it will be included.

  • The current management of the JWT token from the Boundary client to the control plane which involves installing a secret management tool.

What do we still need to test?

Considering the level of progress of the current product development, we would be missing for understanding and trying to:

  • Access management by modifying policies for different users.

  • Perform a deepest research on the components that manage resources (scopes, organizations, host sets, etc.)

Why do we think this product has great future?

Once the product has completed several phases in the roadmap that Hashicorp has established, it will greatly simplify resources access management through bastions in organizations. Access to instances can be managed simply by adding or modifying the permissions that a user has, without having to distribute ssh keys, perform manual operations on the machines, etc.

In summary, this product gives us a new way to manage access to different resources. Not only through SSH, but it will be a way to manage access through roles to machines, databases, portals, etc. minimizing the possible attack vector when permissions are given to contractors. In addition, it is presented as a free and open source tool, which will not only integrate very effectively if you have the Hashicorp ecosystem deployed, but will also work seamlessly without the rest of Hashicorp’s tools.

One More Thing…

We encountered a problem caused by the way in which the information about the network addresses of controllers and workers for subsequent communication was stored. After running our scenario with a workaround based on iptables we decided to open a issue on Github. In only one day, they solved the problem by updating their code. We downloaded the new version of the code, tested it and it worked perfectly. Point in favour for Hashicorp for the speed of response and the efficiency they demonstrated. In addition, recently it has been published a new release of Boundary, including this fix along with many other features Boundary v0.1.2.

¿Quieres saber más de lo que ofrecemos y ver otros casos de éxito?
DESCUBRE BLUETAB

SOLUCIONES, SOMOS EXPERTOS

DATA STRATEGY
DATA FABRIC
AUGMENTED ANALYTICS

Te puede interesar

Spying on your Kubernetes with Kubewatch

September 14, 2020
LEER MÁS

IBM to acquire Bluetab

July 9, 2021
LEER MÁS

Big Data and loT

February 10, 2021
LEER MÁS

Cómo preparar la certificación AWS Data Analytics – Specialty

November 17, 2021
LEER MÁS

¿Existe el Azar?

November 10, 2021
LEER MÁS

Container vulnerability scanning with Trivy

March 22, 2024
LEER MÁS

Filed Under: Blog, Practices, Tech

Spying on your Kubernetes with Kubewatch

September 14, 2020 by Bluetab

Spying on your Kubernetes with Kubewatch

Bluetab

At Cloud Practice we aim to encourage adoption of the cloud as a way of working in the IT world. To help with this task, we are going to publish numerous good practice articles and use cases and others will talk about those key services within the cloud.

This time we will talk about Kubewatch.

What is Kubewatch?

Kubewatch is a utility developed by Bitnami Labs that enables notifications to be sent to various communication systems.

Supported webhooks are:

  • Slack
  • Hipchat
  • Mattermost
  • Flock
  • Webhook
  • Smtp

Kubewatch integration with Slack

The available images are published in the bitnami/kubewatch GitHub

You can download the latest version to test it in your local environment:

$ docker pull bitnami/kubewatch 

Once inside the container, you can play with the options:

$ kubewatch -h

Kubewatch: A watcher for Kubernetes

kubewatch is a Kubernetes watcher that publishes notifications
to Slack/hipchat/mattermost/flock channels. It watches the cluster
for resource changes and notifies them through webhooks.

supported webhooks:
 - slack
 - hipchat
 - mattermost
 - flock
 - webhook
 - smtp

Usage:
  kubewatch [flags]
  kubewatch [command]

Available Commands:
  config      modify kubewatch configuration
  resource    manage resources to be watched
  version     print version

Flags:
  -h, --help   help for kubewatch

Use "kubewatch [command] --help" for more information about a command. 

For what types of resources can you get notifications?

  • Deployments
  • Replication controllers
  • ReplicaSets
  • DaemonSets
  • Services
  • Pods
  • Jobs
  • Secrets
  • ConfigMaps
  • Persistent volumes
  • Namespaces
  • Ingress controllers

When will you receive a notification?

As soon as there is an action on a Kubernetes object, as well as creation, destruction or updating.

Configuration

Firstly, create a Slack channel and associate a webhook with it. To do this, go to the Apps section of Slack, search for “Incoming WebHooks” and press “Add to Slack”:

If there is no channel created for this purpose, register a new one:

In this example, the channel to be created will be called “k8s-notifications”. Then you have to configure the webhook at the “Incoming WebHooks” panel and adding a new configuration where you will need to select the name of the channel to which you want to send notifications. Once selected, the configuration will return a ”Webhook URL” that will be used to configure Kubewatch. Optionally, you can select the icon (“Customize Icon” option) that will be shown on the events and the name with which they will arrive (“Customize Name” option).

You are now ready to configure the Kubernetes resources. There are some example manifests and also the option of installing by Helm on the Kubewatch GitHub However, here we will build our own.

First, create a file “kubewatch-configmap.yml” with the ConfigMap that will be used to configure the Kubewatch container:

apiVersion: v1
kind: ConfigMap
metadata:
  name: kubewatch
data:
  .kubewatch.yaml: |
    handler:
      webhook:
        url: https://hooks.slack.com/services/<your_webhook>
    resource:
      deployment: true
      replicationcontroller: true
      replicaset: false
      daemonset: true
      services: true
      pod: false
      job: false
      secret: true
      configmap: true
      persistentvolume: true
      namespace: false 

You simply need to enable the types of resources on which you wish to receive notifications with “true” or disable them with “false”. Also set the url of the Incoming WebHook registered previously.

Now, for your container to have access the Kubernetes resources through its api, register the “kubewatch-service-account.yml” file with a Service Account, a Cluster Role and a Cluster Role Binding:

kind: ClusterRole
apiVersion: rbac.authorization.k8s.io/v1
metadata:
  name: kubewatch
rules:
- apiGroups: ["*"]
  resources: ["pods", "pods/exec", "replicationcontrollers", "namespaces", "deployments", "deployments/scale", "services", "daemonsets", "secrets", "replicasets", "persistentvolumes"]
  verbs: ["get", "watch", "list"]
---
apiVersion: v1
kind: ServiceAccount
metadata:
  name: kubewatch
  namespace: default
---
apiVersion: rbac.authorization.k8s.io/v1beta1
kind: ClusterRoleBinding
metadata:
  name: kubewatch
roleRef:
  apiGroup: rbac.authorization.k8s.io
  kind: ClusterRole
  name: kubewatch
subjects:
  - kind: ServiceAccount
    name: kubewatch
    namespace: default 

Finally, create a “kubewatch.yml” file to deploy the application:

apiVersion: v1
kind: Pod
metadata:
  name: kubewatch
  namespace: default
spec:
  serviceAccountName: kubewatch
  containers:
  - image: bitnami/kubewatch:0.0.4
    imagePullPolicy: Always
    name: kubewatch
    envFrom:
      - configMapRef:
          name: kubewatch
    volumeMounts:
    - name: config-volume
      mountPath: /opt/bitnami/kubewatch/.kubewatch.yaml
      subPath: .kubewatch.yaml
  - image: bitnami/kubectl:1.16.3
    args:
      - proxy
      - "-p"
      - "8080"
    name: proxy
    imagePullPolicy: Always
  restartPolicy: Always
  volumes:
  - name: config-volume
    configMap:
      name: kubewatch
      defaultMode: 0755 

You will see that the value of the “mountPath” key will be the file path where the configuration of your ConfigMap will be written within the container (/opt/bitnami/kubewatch/.kubewatch.yaml). You can expand the information on how to mount configurations in Kubernetes here. In this example, you can see that our application deployment will be through a single pod. Obviously, in a production system you would need to define a Deployment with the number of replicas considered appropriate to keep it active, even in case of loss of the pod.

Once the manifests are ready apply them to your cluster:

$ kubectl apply  -f kubewatch-configmap.yml -f kubewatch-service-account.yml -f kubewatch.yml 

The service will be ready in a few seconds:

$ kubectl get pods |grep -w kubewatch

kubewatch                                  2/2     Running     0          1m 

The Kubewatch pod has two containers associated: Kubewatch and kube-proxy, the latter to connect to the API.

$   kubectl get pod kubewatch  -o jsonpath='{.spec.containers[*].name}'

kubewatch proxy 

Check through the logs that the two containers have started up correctly and without error messages:

$ kubectl logs kubewatch kubewatch

==> Config file exists...
level=info msg="Starting kubewatch controller" pkg=kubewatch-daemonset
level=info msg="Starting kubewatch controller" pkg=kubewatch-service
level=info msg="Starting kubewatch controller" pkg="kubewatch-replication controller"
level=info msg="Starting kubewatch controller" pkg="kubewatch-persistent volume"
level=info msg="Starting kubewatch controller" pkg=kubewatch-secret
level=info msg="Starting kubewatch controller" pkg=kubewatch-deployment
level=info msg="Starting kubewatch controller" pkg=kubewatch-namespace
... 
$ kubectl logs kubewatch proxy

Starting to serve on 127.0.0.1:8080 

You could also access the Kubewatch container to test the cli, view the configuration, etc.:

$  kubectl exec -it kubewatch -c kubewatch /bin/bash 

Your event notifier is now ready!

Now you need to test it. Let’s use the creation of a deployment as an example to test proper operation:

$ kubectl create deployment nginx-testing --image=nginx
$ kubectl logs -f  kubewatch kubewatch

level=info msg="Processing update to deployment: default/nginx-testing" pkg=kubewatch-deployment 

The logs now alert you that the new event has been detected, so go to your Slack channel to confirm it:

The event has been successfully reported!

Now you can eliminate the test deployment:

$ kubectl delete deploy nginx-testing 

Conclusions

Obviously, Kubewatch does not replace the basic warning and monitoring systems that all production orchestrators need to maintain, but it does provide an easy and effective way to extend control over the creation and modification of resources in Kubernetes. In this example case we performed a Kubewatch configuration across the whole cluster, “spying” on all kinds of events, some of which are perhaps useless if the platform is maintained as a service, as we would be aware of each of the pods created, removed or updated by each development team in its own namespace, which is common, legitimate and does not add value. It may be more appropriate to filter by the namespaces for which you wish to receive notifications, such as kube-system, which is where we generally host administrative services and where only administrators should have access. In that case, you would simply need to specify the namespace in your ConfigMap:

apiVersion: v1
kind: ConfigMap
metadata:
  name: kubewatch
data:
  .kubewatch.yaml: |
    namespace: "kube-system"
    handler:
      webhook:
        url: https://hooks.slack.com/services/<your_webhook>
    resource:
      deployment: true
      replicationcontroller: true
      replicaset: false 

Another interesting utility may be to “listen” to our cluster after a significant configuration adjustment, such as our self-scaling strategy, integration tools and so on, as it will always notify us of the scale ups and scale downs, which could be especially useful initially. In short, Kubewatch extends control over clusters, and we decide the scope we give it. In later articles we will look at how to manage logs and metrics productively.

Do you want to know more about what we offer and to see other success stories?
DISCOVER BLUETAB

SOLUTIONS, WE ARE EXPERTS

DATA STRATEGY
DATA FABRIC
AUGMENTED ANALYTICS

You may be interested in

Hashicorp Boundary

December 3, 2020
READ MORE

Snowflake, el Time Travel sin DeLorean para unos datos Fail-Safe.

February 23, 2023
READ MORE

Cómo depurar una Lambda de AWS en local

October 8, 2020
READ MORE

El futuro del Cloud y GenIA en el Next ’23

September 19, 2023
READ MORE

MDM as a Competitive Advantage in Organizations

June 18, 2024
READ MORE

Starburst: Construyendo un futuro basado en datos.

May 25, 2023
READ MORE

Filed Under: Blog, Practices, Tech

Introduction to HashiCorp products

August 25, 2020 by Bluetab

Introduction to HashiCorp products

Jorge de Diego

Cloud DevOps Engineer

At Cloud Practice we look to encourage the use of HashiCorp products and we are going to publish thematic articles on each of them to do this.

Due to the numerous possibilities their products offer, this article will provide an overview, and we will go into detail on each of them in later publications, showing unconventional use cases that show the potential of HashiCorp products.

Why HashiCorp?

HashiCorp has been developing a variety of Open Source products over recent years that offer cross-cutting infrastructure management in cloud and on-premises environments. These products have set standards in infrastructure automation.

Its products now provide robust solutions in provisioning, security, interconnection and workload coordination fields.

The source code for its products is released under MIT licence, which has been well received within the Open Source community (over 100 developers are continually providing improvements)

In addition to the products we present in this article, they also have attractive Enterprise solutions.

As regards the impact of its solutions, Terraform has become a standard on the market. This means HashiCorp is doing things right, so understanding and learning about its solutions is appropriate.

Although we are focusing on their use in the Cloud environment, their solutions are widely used in on-premises environments, but they reach their full potential when working in the cloud.

What are their products?

HashiCorp has the following products:

  • Terraform: infrastructure as code.
  • Vagrant: virtual machines for test environments.
  • Packer: automated building of images.
  • Nomad: workload “orchestrator”.
  • Vault: management of secrets and data protection.
  • Consul: management and discovery of services in distributed environments.


We summarise the main product features below. We will go into detail on each of them in later publications.

Terraform has positioned itself as the most widespread product in the field of provisioning of Infrastructure as Code.

It uses a specific language (HCL) to deploy infrastructure through the use of various Cloud providers. Terraform also lets you manage resources from other technologies or services, such as GitLab or Kubernetes.

Terraform makes use of a declarative language and is based on having deployed exactly what is present in the code.

The typical example shown to see the difference with the paradigm followed, for example, by Ansible (procedural) is:

Initially we want to deploy 5 EC2 instances on AWS:

Ansible:

- ec2:
    count: 5
    image: ami-id
    instance_type: t2.micro 

Terraform:

resource "aws_instance" "ejemplo" {
  count         = 5
  ami           = "ami-id"
  instance_type = "t2.micro"
} 

As you can see, there are virtually no differences between the coding. Now we need to deploy two more instances to cope with a heavier workload:

Ansible:

- ec2:
    count: 2
    image: ami-id
    instance_type: t2.micro 

Terraform:

resource "aws_instance" "ejemplo" {
  count         = 7
  ami           = "ami-id"
  instance_type = "t2.micro"
} 

At this point, we can see that while in Ansible we would set the number of instances to be deployed at 2 so that a total of 7 are deployed, in Terraform we would set the number directly to 7 and Terraform knows that it needs to deploy 2 more because there are already 5 deployed.

Another important aspect is that Terraform does not need a Master server such as Chef or Puppet. It is a distributed tool whose common, centralised element is the tfstate file (explained in the next paragraph). It is launched from any site with access to the tfstate (which can be remote, stored in common storage such as AWS S3) and with Terraform installed, which is distributed as a binary downloadable from the HashiCorp website.

The last point to note about Terraform is that it is based on a file called tfstate, in which the information relating to infrastructure status is progressively stored and updated, which it consults to see whether changes need to be made to the infrastructure. It is very important to note that this state is what Terraform knows. Terraform will not connect to AWS to see what is deployed. This means it is necessary to avoid making changes manually to the infrastructure deployed by Terraform (and never Manual changes, ever), as the tfstate file is not updated and inconsistencies will therefore be created.

Vagrant enables you to deploy test environments locally, quickly and very simply, based on code. By default it is used with VirtualBox, but it is compatible with other providers such as VMware or Hyper-V. Machines can be deployed on Cloud providers such as AWS by installing plug-ins. I personally cannot find advantages in using Vagrant for this function.

The machines it deploys are based on boxes, and you indicate which box you want to deploy from the code. Its mode of operating can be compared with Docker in this aspect. However, the basis is completely different. Vagrant creates virtual machines with a virtualisation tool below it (VirtualBox), while Docker deploys containers and its support is a containerisation technology, Vagrant versus Docker.

Typical use cases can be to test Ansible playbooks, recreate a laboratory environment locally in just a few minutes, making a demo, etc.

Vagrant is based on a Vagrantfile. Once located in the directory where this Vagrantfile is located, by running vagrant up, the tool begins to deploy what is indicated within that file.

The steps to launch a virtual machine with Vagrant are:

1. Install Vagrant. It is distributed as a binary file, like all other HashiCorp products.

2. With an example Vagrantfile:

Vagrant.configure("2") do |config|
  config.vm.box = "gbailey/amzn2"
end 

PS: (the parameter 2 within configure refers to the version of Vagrant, which I had to check for the post)

3. Run within the directory where the Vagrantfile is located

vagrant up 

4. Enter the machine using ssh

vagrant ssh 

5. Destroy the machine

vagrant destroy 

Vagrant manages ssh access by creating a private key and storing it in the .vagrant directory, apart from other metadata. The machine can be accessed by running vagrant ssh. The machines deployed can also be displayed in the VirtualBox application.

With Packer you can build automated machine images. It can be used, for example, to build an image on a Cloud provider, such as AWS, already with an initial configuration, and to be able to deploy it an indefinite number of times. This means that you only need to provision it once, and when you deploy the instance with that image you already have the desired configuration without having to spend more time provisioning it.

A simple example would be:

1. Install Packer. Similarly, it is a binary that will need to be placed in a folder located on our path.

2. Create a file, e.g. builder.json. A small script is also created in bash (the link shown in builder.json is dummy):

{
  "variables": {
    "aws_access_key": "{{env `AWS_ACCESS_KEY_ID`}}",
    "aws_secret_key": "{{env `AWS_SECRET_ACCESS_KEY`}}",
    "region": "eu-west-1"
  },
  "builders": [
    {
      "access_key": "{{user `aws_access_key`}}",
      "ami_name": "my-custom-ami-{{timestamp}}",
      "instance_type": "t2.micro",
      "region": "{{user `region`}}",
      "secret_key": "{{user `aws_secret_key`}}",
      "source_ami_filter": {
        "filters": {
            "virtualization-type": "hvm",
            "name": "amzn2-ami-hvm-2*",
            "root-device-type": "ebs"
        },
        "owners": ["amazon"],
        "most_recent": true
      },
      "ssh_username": "ec2-user",
      "type": "amazon-ebs"
    }
  ],
  "provisioners": [
    {
        "type": "shell",
        "inline": [
            "curl -sL https://raw.githubusercontent.com/example/master/userdata/ec2-userdata.sh | sudo bash -xe"
        ]
    }
  ]
} 

Provisioners use builtin and third-party software to install and configure the machine image after booting. Our example ec2-userdata.sh

yum install -y \
  python3 \
  python3-pip \

pip3 install cowsay 

3. Run:

packer build builder.json 

And we would already have an AMI provisioned with cowsay installed. Now it will never be necessary for you, as a first step after launching an instance, to install cowsay because we will already have it as a base, as it should be.

As you would expect, Packer not only works with AWS, but also with any Cloud provider such as Azure or GCP. It also works with VirtualBox and VMware and a long list of builders. You can also create an image by nesting builders in the Packer configuration file that is the same for various Cloud providers. This is very interesting for multi-cloud environments, where different configurations need to be replicated.

Nomad is a workload orchestrator. Through its Task Drivers they execute a task in an isolated environment. The most common use case is to orchestrate Docker containers. It has two basic actors: Nomad Server and Nomad Client. The two actors are run with the same binary, but different configurations. Servers organise the cluster, while Agents run the tasks.

A little “Hello world” in Nomad could be:

1. Download and install Nomad and run it (in development mode; this mode must never be used in production):

nomad agent -dev 

Once this has been done, you can access the Nomad UI at localhost:4646

2. Run an example job that will launch a Grafana image

nomad job run grafana.nomad 

grafana.nomad:

job "grafana" {
    datacenters = [
        "dc1"
    ]

    group "grafana" {
        task "grafana"{
            driver = "docker"

            config {
                image = "grafana/grafana"
            }

            resources {
                cpu = 500
                memory = 256

            network {
                mbits = 10

                port "http" {
                    static = "3000"
                }
            }
            }
        }
    }
} 

3. Access localhost:3000 to check that you can access grafana and access the Nomad UI (localhost:4646) to view the job

4. Destroy the job

nomad stop grafana 

5. Stop the Nomad agent. If it has been run as indicated here, pressing Control-C on the terminal where it is running will suffice

In short, Nomad is a very light orchestrator, unlike Kubernetes. Logically, it does not have the same features as Kubernetes, but it offers the ability to run workloads at high availability easily and without the need for a large amount of resources. We will deal with examples in greater detail in the post on Nomad to be published in the future.

Vault manages secrets. Users or applications can request secrets or identities through its API. These users are authenticated in Vault, which has a connection to a trusted identity provider such as an Active Directory, for example. Vault works with two types of actors, like the other tools mentioned, Server and Agent.

When Vault starts up, it starts in a sealed state (Seal) and various tokens are generated for unsealing (Unseal). An actual use case would be too long for this article and we will look at this in detail in the article on Vault alone. However, you can download and test it in dev mode as noted previously for Nomad. In this mode, Vault starts up in Unsealed mode, storing everything in memory without need for authentication, without using TLS, and with a single sealing key. You can play with its features and explore it quickly and easily in this way.

See this link for further information.

1. Install Vault. Like the rest of HashiCorp’s products, it is distributed as a binary through its website. Once done, launch (this mode must never be used in production):

vault server -dev 

2. Vault will display the root token used to authenticate against Vault. It will also display the single sealing key it creates. Vault is now accessible via localhost:8200

3. In another terminal, export the following variables to be able to conduct tests:

export VAULT_ADDR='http://127.0.0.1:8200'
export VAULT_DEV_ROOT_TOKEN_ID="token-showed-when-running-vault-dev" 

4. Create a secret (in the terminal where the above variables were exported)

vault kv put secret/test supersecreto=iewdubwef293bd8dn0as90jdasd 

5. Recover that secret

vault kv get secret/test 

These steps are the Hello world of Vault, to check its operation. We will look in detail at the operation and installation of Vault in the article on it, as well as at further features such as the policies, exploring the UI, etc.

Consul is used to create a services network. It operates in a distributed manner and a Consul client will run in a location where there are services that you want to register. Consul includes Health Checking of services, a key value database and features to secure network traffic. Like Nomad and Vault, Consul has two primary actors, Server and Agent.

Just as we did with Nomad and Vault, we are going to run Consul in dev mode to show a small example defining a service:

1. Install Consul. Create a working folder and within it create a json file with a service to be defined (example folder name: consul.d).

web.json file (HashiCorp website example):

{
  "service": {
    "name": "web",
    "tags": [
      "rails"
    ],
    "port": 80
  }
} 

2. Run the Consul agent by pointing it to the configuration directory created before where web.json is located (this mode must never be used in production):

consul agent -dev -enable-script-checks -config-dir=./consul.d 

3. From now, although there is nothing actually running on the indicated port (80), a service has been created with a DNS name that can be requested to access it through that DNS name. Its name will be NAME.service.consul. In our case NAME is web. Run to query:

dig @127.0.0.1 -p 8600 web.service.consul 

Note: Consul runs by default on port 8600.

Similarly, you can dig for a record of SRV type:

dig @127.0.0.1 -p 8600 web.service.consul SRV 

You can also query through the service tags (TAG.NAME.service.consul):

dig @127.0.0.1 -p 8600 rails.web.service.consul 

And you can query through the API:

curl http://localhost:8500/v1/catalog/service/web 

Final note: Consul is used as a complement to other products, as it is used to create services on other tools already deployed. That is why this example is not too illustrative. Apart from the specific article on Consul, it will be found as an example in other articles, such as the one on Nomad.

Future articles will also explain Consul Service Mesh for interconnection of services via Sidecar proxies, federation of Nomad Datacentres in Consul to perform deployments or intentions, which are used to define rules under which services can communicate with another service.

Conclusions

All these products have great potential in their respective areas and offer cross-cutting management that can help to avoid the famous vendor lock-in by Cloud providers. But the most important thing is their interoperability and compatibility.

¿Quieres saber más de lo que ofrecemos y ver otros casos de éxito?
DESCUBRE BLUETAB
Jorge de Diego
Cloud DevOps Engineer

My name is Jorge de Diego and I specialise in Cloud environments. I usually work with AWS, although I have knowledge of GCP and Azure. I joined Bluetab in September 2019 and have been working on Cloud DevOps and security tasks since then. I am interested in everything related to technology, especially security models and Infrastructure fields. You can spot me in the office by my shorts.

SOLUTIONS, WE ARE EXPERTS

DATA STRATEGY
DATA FABRIC
AUGMENTED ANALYTICS

You may be interested in

Oscar Hernández, new CEO of Bluetab LATAM.

May 16, 2024
READ MORE

Snowflake Advanced Storage Guide

October 3, 2022
READ MORE

Databricks on Azure – An Architecture Perspective (part 1)

February 15, 2022
READ MORE

Mi experiencia en el mundo de Big Data – Parte II

February 4, 2022
READ MORE

Using Large Language Models on Private Information

March 11, 2024
READ MORE

De documentos en papel a datos digitales con Fastcapture y Generative AI

June 7, 2023
READ MORE

Filed Under: Blog, Practices, Tech

Basic AWS Glue concepts

July 22, 2020 by Bluetab

Basic AWS Glue concepts

Álvaro Santos

Senior Cloud Solution Architect​

At Cloud Practice we aim to encourage adoption of the cloud as a way of working in the IT world. To help with this task, we are going to publish numerous good practice articles and use cases and others will talk about those key services within the cloud.

We present the basic concepts AWS Glue below.

What is AWS Glue?

AWS Glue is one of those AWS services that are relatively new but have enormous potential. In particular, this service could be very useful to all those companies that work with data and do not yet have powerful Big Data infrastructure.

Basically, Glue is a fully AWS-managed pay-as-you-go ETL service without the need for provisioning instances. To achieve this, it combines the speed and power of Apache Spark with the data organisation offered by Hive Metastore.

AWS Glue Data Catalogue

The Glue Data Catalogue is where all the data sources and destinations for Glue jobs are stored.

  • Table is the definition of a metadata table on the data sources and not the data itself. AWS Glue tables can refer to data based on files stored in S3 (such as Parquet, CSV, etc.), RDBMS tables…

  • Database refers to a grouping of data sources to which the tables belong.

  • Connection is a link configured between AWS Glue and an RDS, Redshift or other JDBC-compliant database cluster. These allow Glue to access their data.

  • Crawler is the service that connects to a data store, it progresses through a prioritised list of classifiers to determine the schema for the data and to generate the metadata tables. They support determining the schema of complex unstructured or semi-structured data. This is especially important when working with Parquet, AVRO, etc. data sources.

ETL

An ETL in AWS Glue consists primarily of scripts and other tools that use the data configured in the Data Catalogue to extract, transform and load the data into a defined site.

  • Job is the main ETL engine. A job consists of a script that loads data from the sources defined in the catalogue and performs transformations on them. Glue can generate a script automatically or you can create a customised one using the Apache Spark API in Python (PySpark) or Scala. It also allows the use of external libraries which will be linked to the job by means of a zip file in S3.

  • Triggers are responsible for running the Jobs. They can be run according to a timetable, a CloudWatch event or even a cron command.

  • Workflows is a set of triggers, crawlers and jobs related to each other in AWS Glue. You can use them to create a workflow to perform a complex multi-step ETL, but that AWS Glue can run as a single entity.

  • ML Transforms are specific jobs that use Machine Learning models to create custom transforms for data cleaning, such as identifying duplicate data, for example.

  • Finally, you can also use Dev Endpoints and Notebooks, which make it faster and easier to develop and test scripts.

Examples

Sample ETL script in Python:

import sys
from awsglue.transforms import *
from awsglue.utils import getResolvedOptions
from pyspark.context import SparkContext
from awsglue.context import GlueContext
from awsglue.dynamicframe import DynamicFrame
from awsglue.job import Job

args = getResolvedOptions(sys.argv, ['JOB_NAME'])

sc = SparkContext()

glueContext = GlueContext(sc)
spark = glueContext.spark_session
job = Job(glueContext)

## Read Data from a RDS DB using JDBC driver
connection_option = {
"url": "jdbc:mysql://mysql–instance1.123456789012.us-east-1.rds.amazonaws.com:3306/database",
"user": "test",
"password": "password",
"dbtable": "test_table",
"hashexpression": "column_name",
"hashpartitions": "10"
}

source_df = glueContext.create_dynamic_frame.from_options('mysql', connection_options = connection_option, transformation_ctx = "source_df")

job.init(args['JOB_NAME'], args)

## Convert DataFrames to *AWS Glue* 's DynamicFrames Object
dynamic_df = DynamicFrame.fromDF(source_df, glueContext, "dynamic_df")

## Write Dynamic Frame to S3 in CSV format
datasink = glueContext.write_dynamic_frame.from_options(frame = dynamic_df, connection_type = "s3", connection_options = {
"path": "s3://glueuserdata"
}, format = "csv", transformation_ctx = "datasink")

job.commit() 

Creating a Job using a command line:

aws glue create-job --name python-job-cli --role Glue_DefaultRole \

--command '{"Name" : "my_python_etl", "ScriptLocation" : "s3://SOME_BUCKET/etl/my_python_etl.py"}' 

Running a Job using a command line:

aws glue start-job-run --job-name my_python_etl 

AWS has also published a repository with numerous example ETLs for AWS Glue.

Security

Like all AWS services, it is designed and implemented to provide the greatest possible security. Here are some of the security features that AWS GLUE offers:

  • Encryption at Rest: this service supports data encryption (SSE-S3 or SSE-KMS) at rest for all objects it works with (metadata catalogue, connection password, writing or reading of ETL data, etc.).

  • Encryption in Transit: AWS offers Secure Sockets Layer (SSL) encryption for all data in motion, AWS Glue API calls and all AWS services, such as S3, RDS…

  • Logging and monitoring: is tightly integrated with AWS CloudTrail and AWS CloudWatch.

  • Network security: is capable of enabling connections within a private VPC and working with Security Groups.

Price

AWS bills for the execution time of the ETL crawlers / jobs and for the use of the Data Catalogue.

  • Crawlers: only crawler run time is billed. The price is $0.44 (eu-west-1) per hour of DPU (4 vCPUs and 16 GB RAM), billed in hourly increments.

  • Data Catalogue: you can store up to one million objects at no cost and at $1.00 (eu-west-1) per 100,000 objects thereafter. In addition, $1 (eu-west-1) is billed for every 1,000,000 requests to the Data Catalogue, of which first million is free.

  • ETL Jobs: billed only for the time the ETL job takes to run. The price is $0.44 (eu-west-1) per hour of DPU (4 vCPUs and 16 GB RAM), billed by the second.

Benefits

Although it is a young service, it is quite mature and is being used a lot by clients all over the AWS world. The most important features it offers us are:

  • It automatically manages resource escalation, task retries and error handling.

  • It is a Serverless service, AWS manages the provisioning and scaling of resources to execute the commands or queries in the Apache Spark environment.

  • The crawlers are able to track your data, suggest schemas and store them in a centralised catalogue. They also detect changes in them.

  • The Glue ETL engine automatically generates Python / Scala code and has a programmer including dependencies. This facilitates development of the ETLs.

  • You can directly query the S3 data using Athena and Redshift Spectrum using the Glue catalogue.

Conclusions

Like any database, tool, or service offered, AWS Glue has certain limitations that would need to be considered to adopt it as an ETL service. You therefore need to bear in mind that:

  • It is highly focused on working with data sources in S3 (CSV, Parquet, etc.) and JDBC (MySQL, Oracle, etc.).

  • The learning curve is steep. If your team comes from the traditional ETL world, you will need to wait for them to pick up understanding of Apache Spark.

  • Unlike other ETL tools, it lacks default compatibility with many third-party services.

  • It is not a 100% ETL tool in use and, as it uses Spark, code optimisations need to be performed manually.

  • Until recently (April 2020), AWS Glue did not support streaming data. It is too early to use AWS Glue as an ETL tool for real-time data.
Do you want to know more about what we offer and to see other success stories?
DISCOVER BLUETAB
Álvaro Santos
Senior Cloud Solution Architect

My name is Álvaro Santos and I have been working as Solution Architect for over 5 years. I am certified in AWS, GCP, Apache Spark and a few others. I joined Bluetab in October 2018, and since then I have been involved in cloud Banking and Energy projects and I am also involved as a Cloud Master Partitioner. I am passionate about new distributed patterns, Big Data, open-source software and anything else cool in the IT world.

SOLUTIONS, WE ARE EXPERTS

DATA STRATEGY
DATA FABRIC
AUGMENTED ANALYTICS

You may be interested in

$ docker run 2021

February 2, 2021
READ MORE

CLOUD SERVICE DELIVERY MODELS

June 27, 2022
READ MORE

Databricks on AWS – An Architectural Perspective (part 2)

March 5, 2024
READ MORE

Desplegando una plataforma CI/CD escalable con Jenkins y Kubernetes

September 22, 2021
READ MORE

Essential features to consider when adopting a cloud paradigm

September 12, 2022
READ MORE

Databricks on AWS – An Architectural Perspective (part 1)

March 5, 2024
READ MORE

Filed Under: Blog, Practices, Tech

  • « Go to Previous Page
  • Page 1
  • Page 2
  • Page 3
  • Page 4

Footer

LegalPrivacy Cookies policy

Patron

Sponsor

© 2025 Bluetab Solutions Group, SL. All rights reserved.